Quarterly Rental Analysis Report
This analytics brief decomposes key transactional micro-signals captured across the Residential Tenancies Authority (RTA) Queensland dataset. By analyzing structural changes in portfolio mobility, asset yield elasticity spreads, recurring seasonal patterns, and supply pool shrinkage, the framework maps current systemic real estate risks and strategic opportunities.
1. Market Mobility & Portfolio Liquidity Index
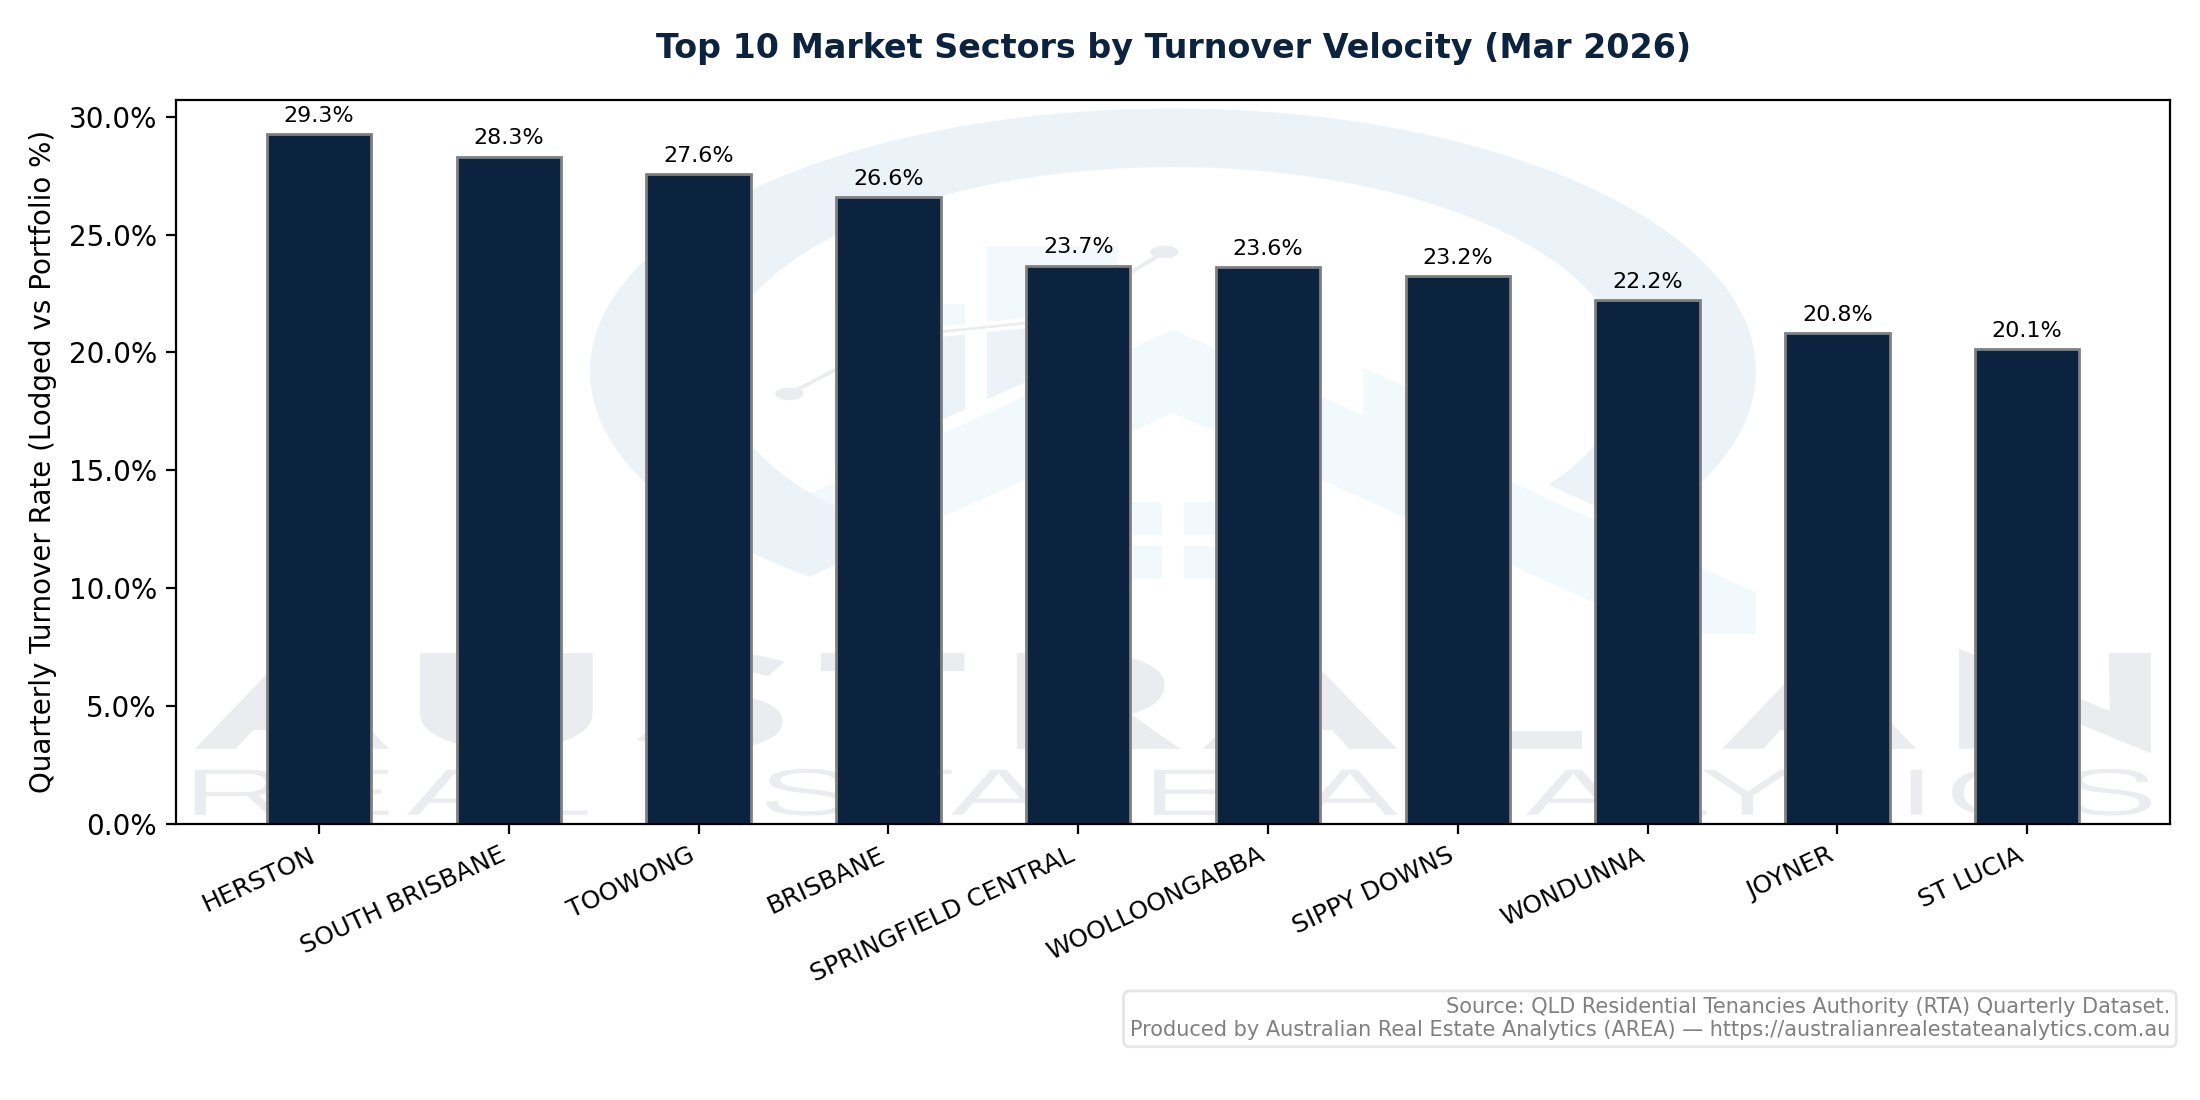
Transactional Velocity Metrics: Measures structural liquidity inside private rental sectors by computing the quarterly operational friction coefficient (New Lodgements vs. Managed Portfolio Base).
| Location | Quarter | Lodged | Held Pool | Velocity |
|---|---|---|---|---|
| SPRING MOUNTAIN | Dec-2018 | 116 | 234 | 49.57% |
| SPRING MOUNTAIN | Sep-2018 | 61 | 125 | 48.80% |
| LAKELAND | Jun-2024 | 49 | 102 | 48.04% |
| BARINGA | Jun-2018 | 54 | 120 | 45.00% |
| BANYA | Sep-2023 | 72 | 160 | 45.00% |
💡 Strategic Advisory Insight
High velocity sectors (approaching ~40-50% turnover) flag transient tenant enclaves, heavy deployment regions, or massive investor settlements in new master-planned hubs. While top-line rent growth may look strong, landlords encounter heightened yield friction due to letting fees, marketing periods, and turn-around maintenance overhead.
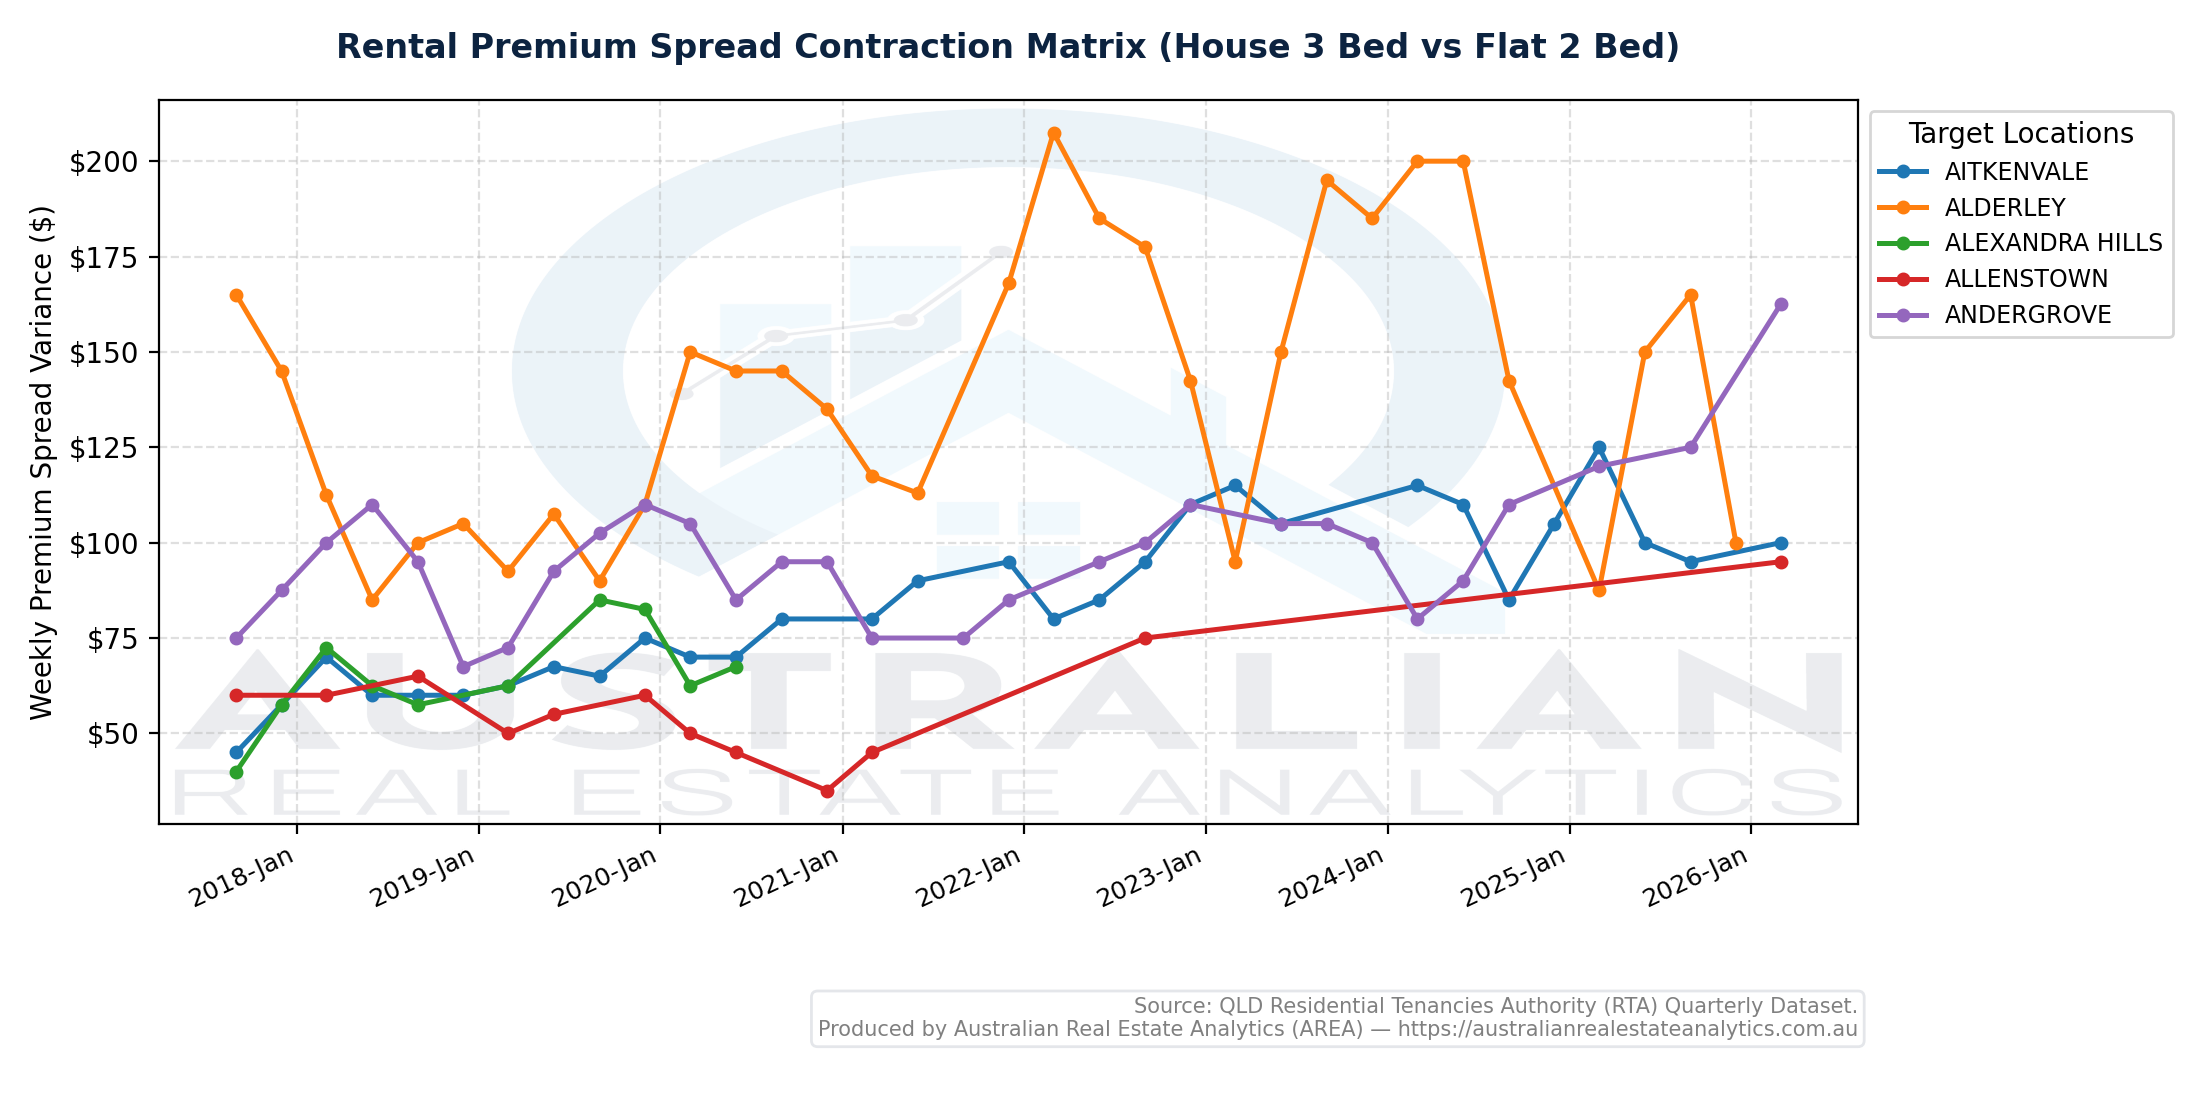
2. Yield Elasticity Asset Variance (Spread Contractions)
Pricing Divergence Spreads: Tracks changes in the weekly cash premium paid for detached houses (3 Bed) versus standard units (2 Bed).
💡 Strategic Advisory Insight
A contracting spread indicates apartment and flat values are expanding faster than houses, signaling that local wages have hit absolute affordability boundaries, pushing density demand up. Widening paths indicate areas fiercely penalizing high-density product in favor of land component retention.
3. Cyclical Lease Seasonality Factor Profiles
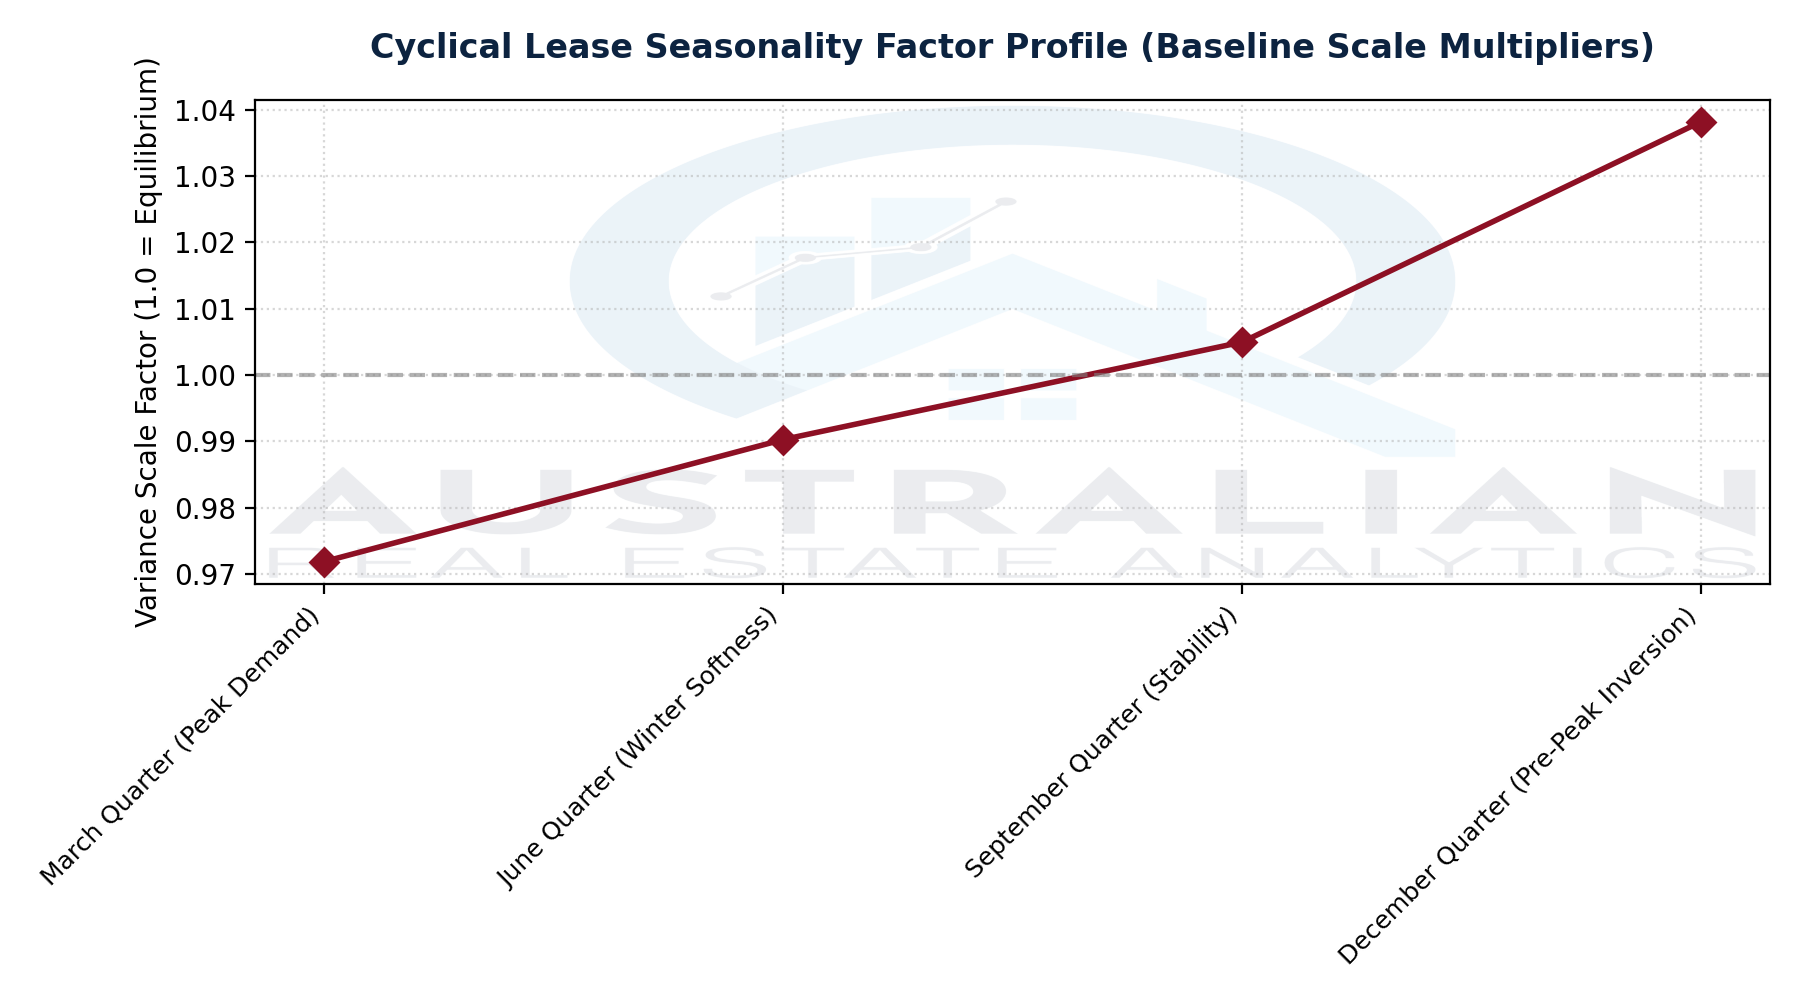
Calendar Multipliers: Establishes recurring, calendar-driven behavior by eliminating macro inflation waves across a multi-year performance framework.
💡 Strategic Advisory Insight
The clear peak in the March quarter establishes a core optimization framework for portfolios. Landlords should avoid standard 12-month terms during June or September valleys. Instead, writing tactical 8 or 14-month leases forces upcoming openings directly into the Q1 surge, securing immediate premium gains with no capital spend.
4. Early-Warning Long-Term Rental Supply Contractions
Portfolio Capital Exodus Flags: Identifies regions experiencing significant double-digit percentage drops in total active long-term rental allocations over a 12-month period.
| Location | Prior Vol | Current Vol | Net Change | YoY Drop % |
|---|---|---|---|---|
| NELLY BAY | 127 | 105 | -22 | -17.3% |
| STRATFORD | 119 | 102 | -17 | -14.3% |
| NEBO | 150 | 131 | -19 | -12.7% |
| MACKAY HARBOUR | 85 | 75 | -10 | -11.8% |
| COOLOOLA COVE | 164 | 147 | -17 | -10.4% |
💡 Strategic Advisory Insight
Double-digit contractions signal that housing inventory is disappearing into owner-occupier hands or converting to short-term holiday platforms (Airbnb). This inventory loss functions as a highly reliable leading indicator for upcoming sharp rental spikes due to severe choice shortfalls.